It’s no secret that we love coffee. In fact, around 98 million cups of coffee are drunk every day in the UK alone (BCA, 2022). Clearly, coffee is one of the most popular beverages on the planet. Every year, coffee producers ship over 9.5 billion kg of coffee–and demand is expected to triple by 2050. But, as much as we love it, we need to consider the impact of coffee production on the planet. What is the carbon cost of coffee, and is it too high?
How Do we Measure the Emissions of Coffee Producers?
Before we can determine the impact of coffee production, we need a way to measure it. Since we know the negative consequences of carbon emissions, it makes sense to use that as a basis for comparison. Fortunately, there is a scale of ‘Carbon dioxide equivalent‘ (or ‘ CO2eq ‘) which allows us to measure impacts using a common unit. For example, a process emitting 1kg of methane equates to 25kg of carbon dioxide (‘ 25 CO2eq ‘) (Brander, 2012).

Coffee Producers: From Bean to Cup
Background context: The complete view of the Coffee Supply Chain
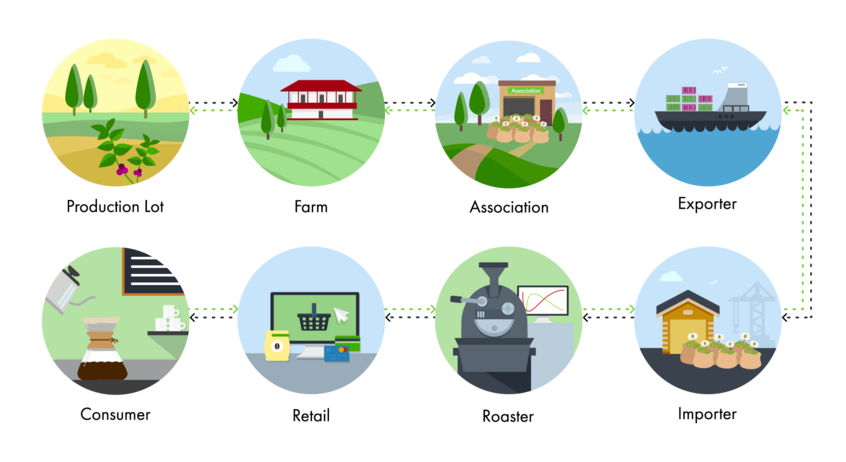
To fully evaluate the impact of coffee production, we need to look at the entire supply chain. A supply chain is all the steps that bring a product to the consumer. A cup of coffee includes the following:
- Production lot and farming (planting and harvesting)
- Association (where the milling process happens)
- Exportation of coffee grains from the producer to the buyers (importers)
- Roasting of coffee beans by the importer (where we obtain the characteristic aroma)
- Selling the final product to retail (cafes or supermarkets).
- Consumer stage, where you drink your cup of coffee
Growing Coffee Plants
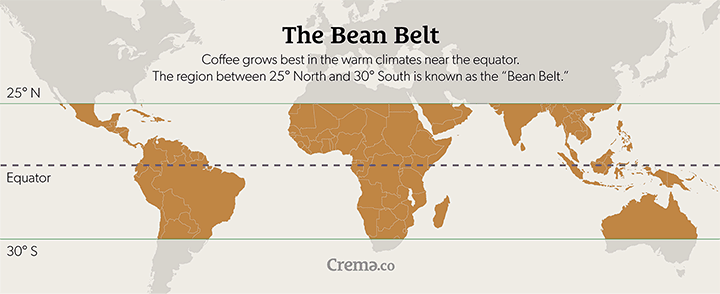
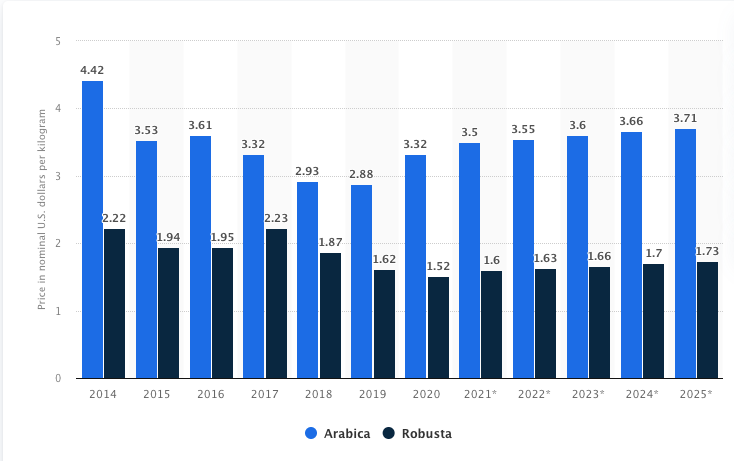
Most often, coffee producers grow the Coffea plant. Currently, the two most popular seeds are Arabica and Robusta (ISIC, 2022). Coffee grows best in the zone between the Tropic of Cancer and the Tropic of Capricorn (ISIC, 2022) , or the ‘Bean Belt’. Then, it takes about three to four years before quality coffee beans are ready for harvest. At this stage, coffee production emits 1.02 kg CO2eq per kg of green coffee beans. Worth noting is that fertilizers make up 95% of those emissions (BALAS, 2012).
Harvesting Coffee Beans
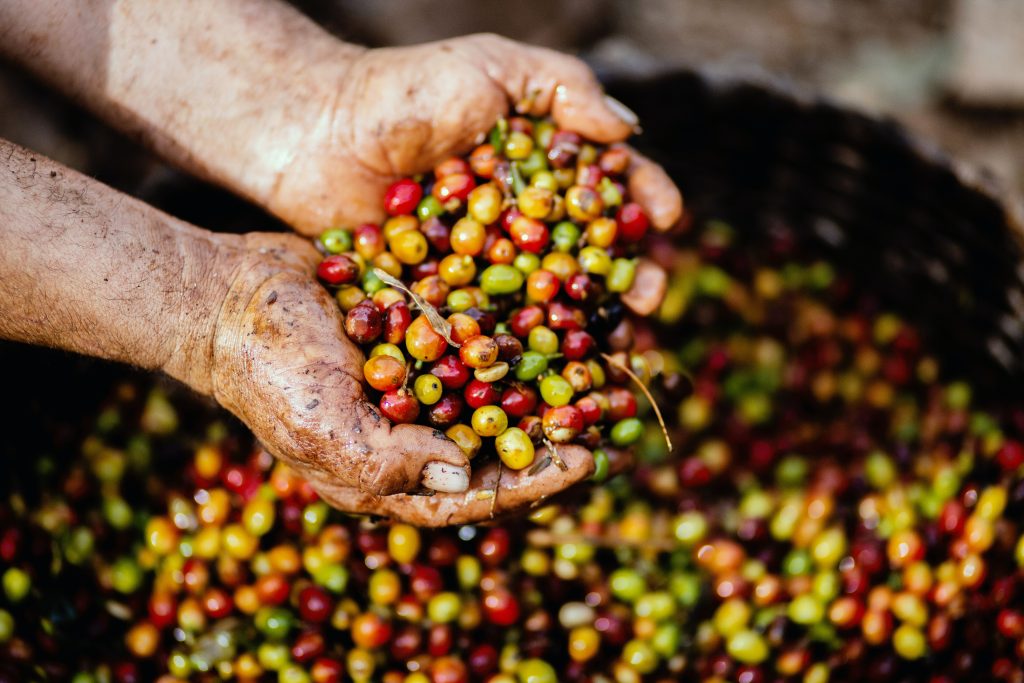
Primarily, hand harvesting is used to select the cherries from mature coffee plants. Coffee producers use this labour-intensive method to preserve bean quality. However, human labour is also the main resource used to grow coffee beans. This is because farms are usually located in rural mountain areas. Accordingly, pickers check the trees every eight to ten days and select only the ripest cherries.
Processing (Milling)
Processing is when the picked coffea cherries are turned into the more familiar coffee beans. Unfortunately for coffee lovers, this process has many negative impacts on the environment. During processing, greenhouse emissions rise significantly due to the industrial activity required for it. For example, in Costa Rica, emissions increase by 0.64kg CO2eq /kg (BALAS, 2012).
Coffee producers use one of two methods to process coffee beans. These methods are called the dry method or the wet method, and their use depends on the availability of water. Interestingly, there is no exact standard on the ideal moisture content for coffee beans. However, the Coffee Guide for Traders (2022) says moisture should get down to 11%.
Regardless of method, separating beans from the fruit produces enormous amounts of pulp and residual waste. Around 40% of the coffee pulp and husk gets thrown away. Cascara, the term for dried husks or skins of pulped coffee cherries, can be an effective fertilizer when fermented. Unfortunately, in practice, 97% of the discarded pulp goes to landfill. The waste decomposes via fermentation, a process that releases the greenhouse gas methane.
Worse, most of the times this waste finds its way into local water sources. Additionally, wastewater pollution from wet milling coffee can be 30 to 40 times greater than urban sewage (The Specialty Coffee Association News).
As a result, there is about 23 million litres of untreated coffee processing waste flowing into the Bolaven rivers in Laos every year (WWF, 2021).
By-products of Producing Coffee
Innovators have tried reducing the carbon footprint of coffee production. One approach is to make use of the 17 billion pounds of coffee cherries thrown away each year. Unfortunately, turning these into biofuels and building materials has not yet been successful.
Coffee Flour is a new by-product made during milling that is bringing some hope. Using discarded cherries as an edible crop is improving the local environment. Coffee Flour is rich in fibre, protein, iron, and calcium. It provides a source of food for developing countries and offers a new source of income.
However, water consumption in the coffee supply chain is still a concern. Studies show that it is around 22458 to 22580 m3 per ton of processed coffee (Chapagain and Hoekstra, 2007).
So, three cups of coffee a day works out to a water footprint of 2.6 billion cubic metres per year! (Chapagain and Hoekstra, 2007)
Emissions due to Exporting Coffee
Finally, beans are sorted and graded either by hand or machine. By this stage, the carbon cost increases by about 1kg CO2eq/kg (BALAS, 2012).
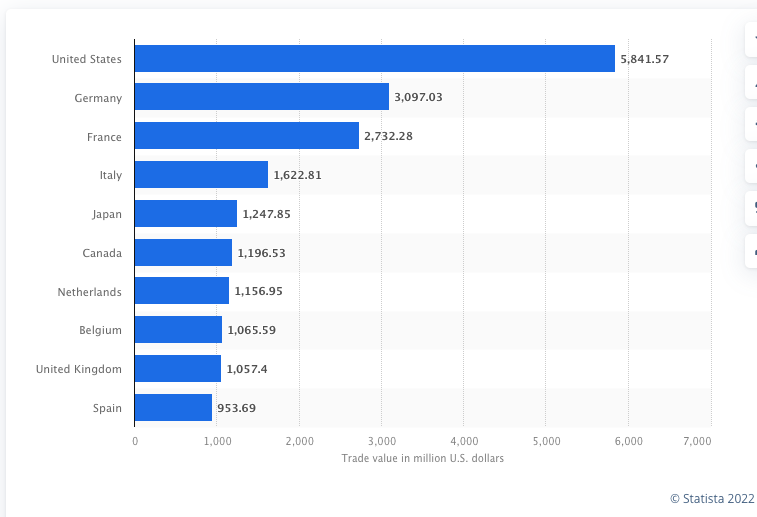
Then, the sorted beans ship to suppliers all over the world. Coffee is grown in the tropical areas of developing countries. However, most of its consumption occurs in the developed world (Statista, 2022). So, transportation plays a big part in the carbon cost.
Emissions due to Roasting Coffee
After the beans reach the suppliers, they are ranked for quality and taste. Then, they are roasted to get their characteristic aroma. At the roasting stage, most emissions come from electricity and thermal energy (BALAS, 2012).
Studies carried out in Peru compare the carbon footprint of roasting technologies. Unsurprisingly, solar power is less impactful, producing 0.318 kg CO2eq eq /kg of roasted coffee. Yet, from local electricity, they are 0.744 kg CO2eq eq/kg of roasted coffee (Franco, Bartl, 2018).
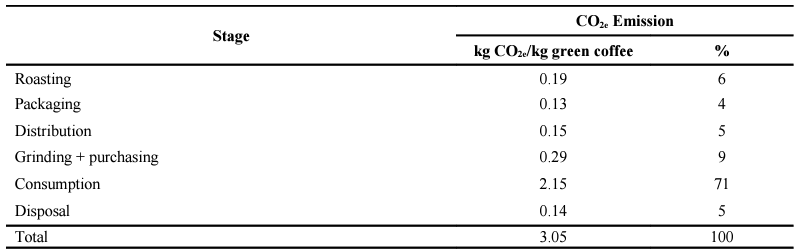
So, by the time you’re sipping on your coffee, it has released an extra 3.05kg CO2eq /kg of carbon (BALAS, 2012) into the atmosphere.
So, what is the Carbon Cost of Coffee Production?
So far, we’ve shown the raw numbers in terms of carbon equivalent costs. To put that into perspective, greenhouse gas emissions from coffee production are equal to the emissions from pigs, poultry, and rice combined (Neufeld, 2020). In Costa Rica, for example, the total carbon footprint is 4.98 kg of CO2eq per kilogram of green coffee (BALAS, 2012). It is important to note that these numbers vary by country due to different technologies (and distances) in the supply chain.
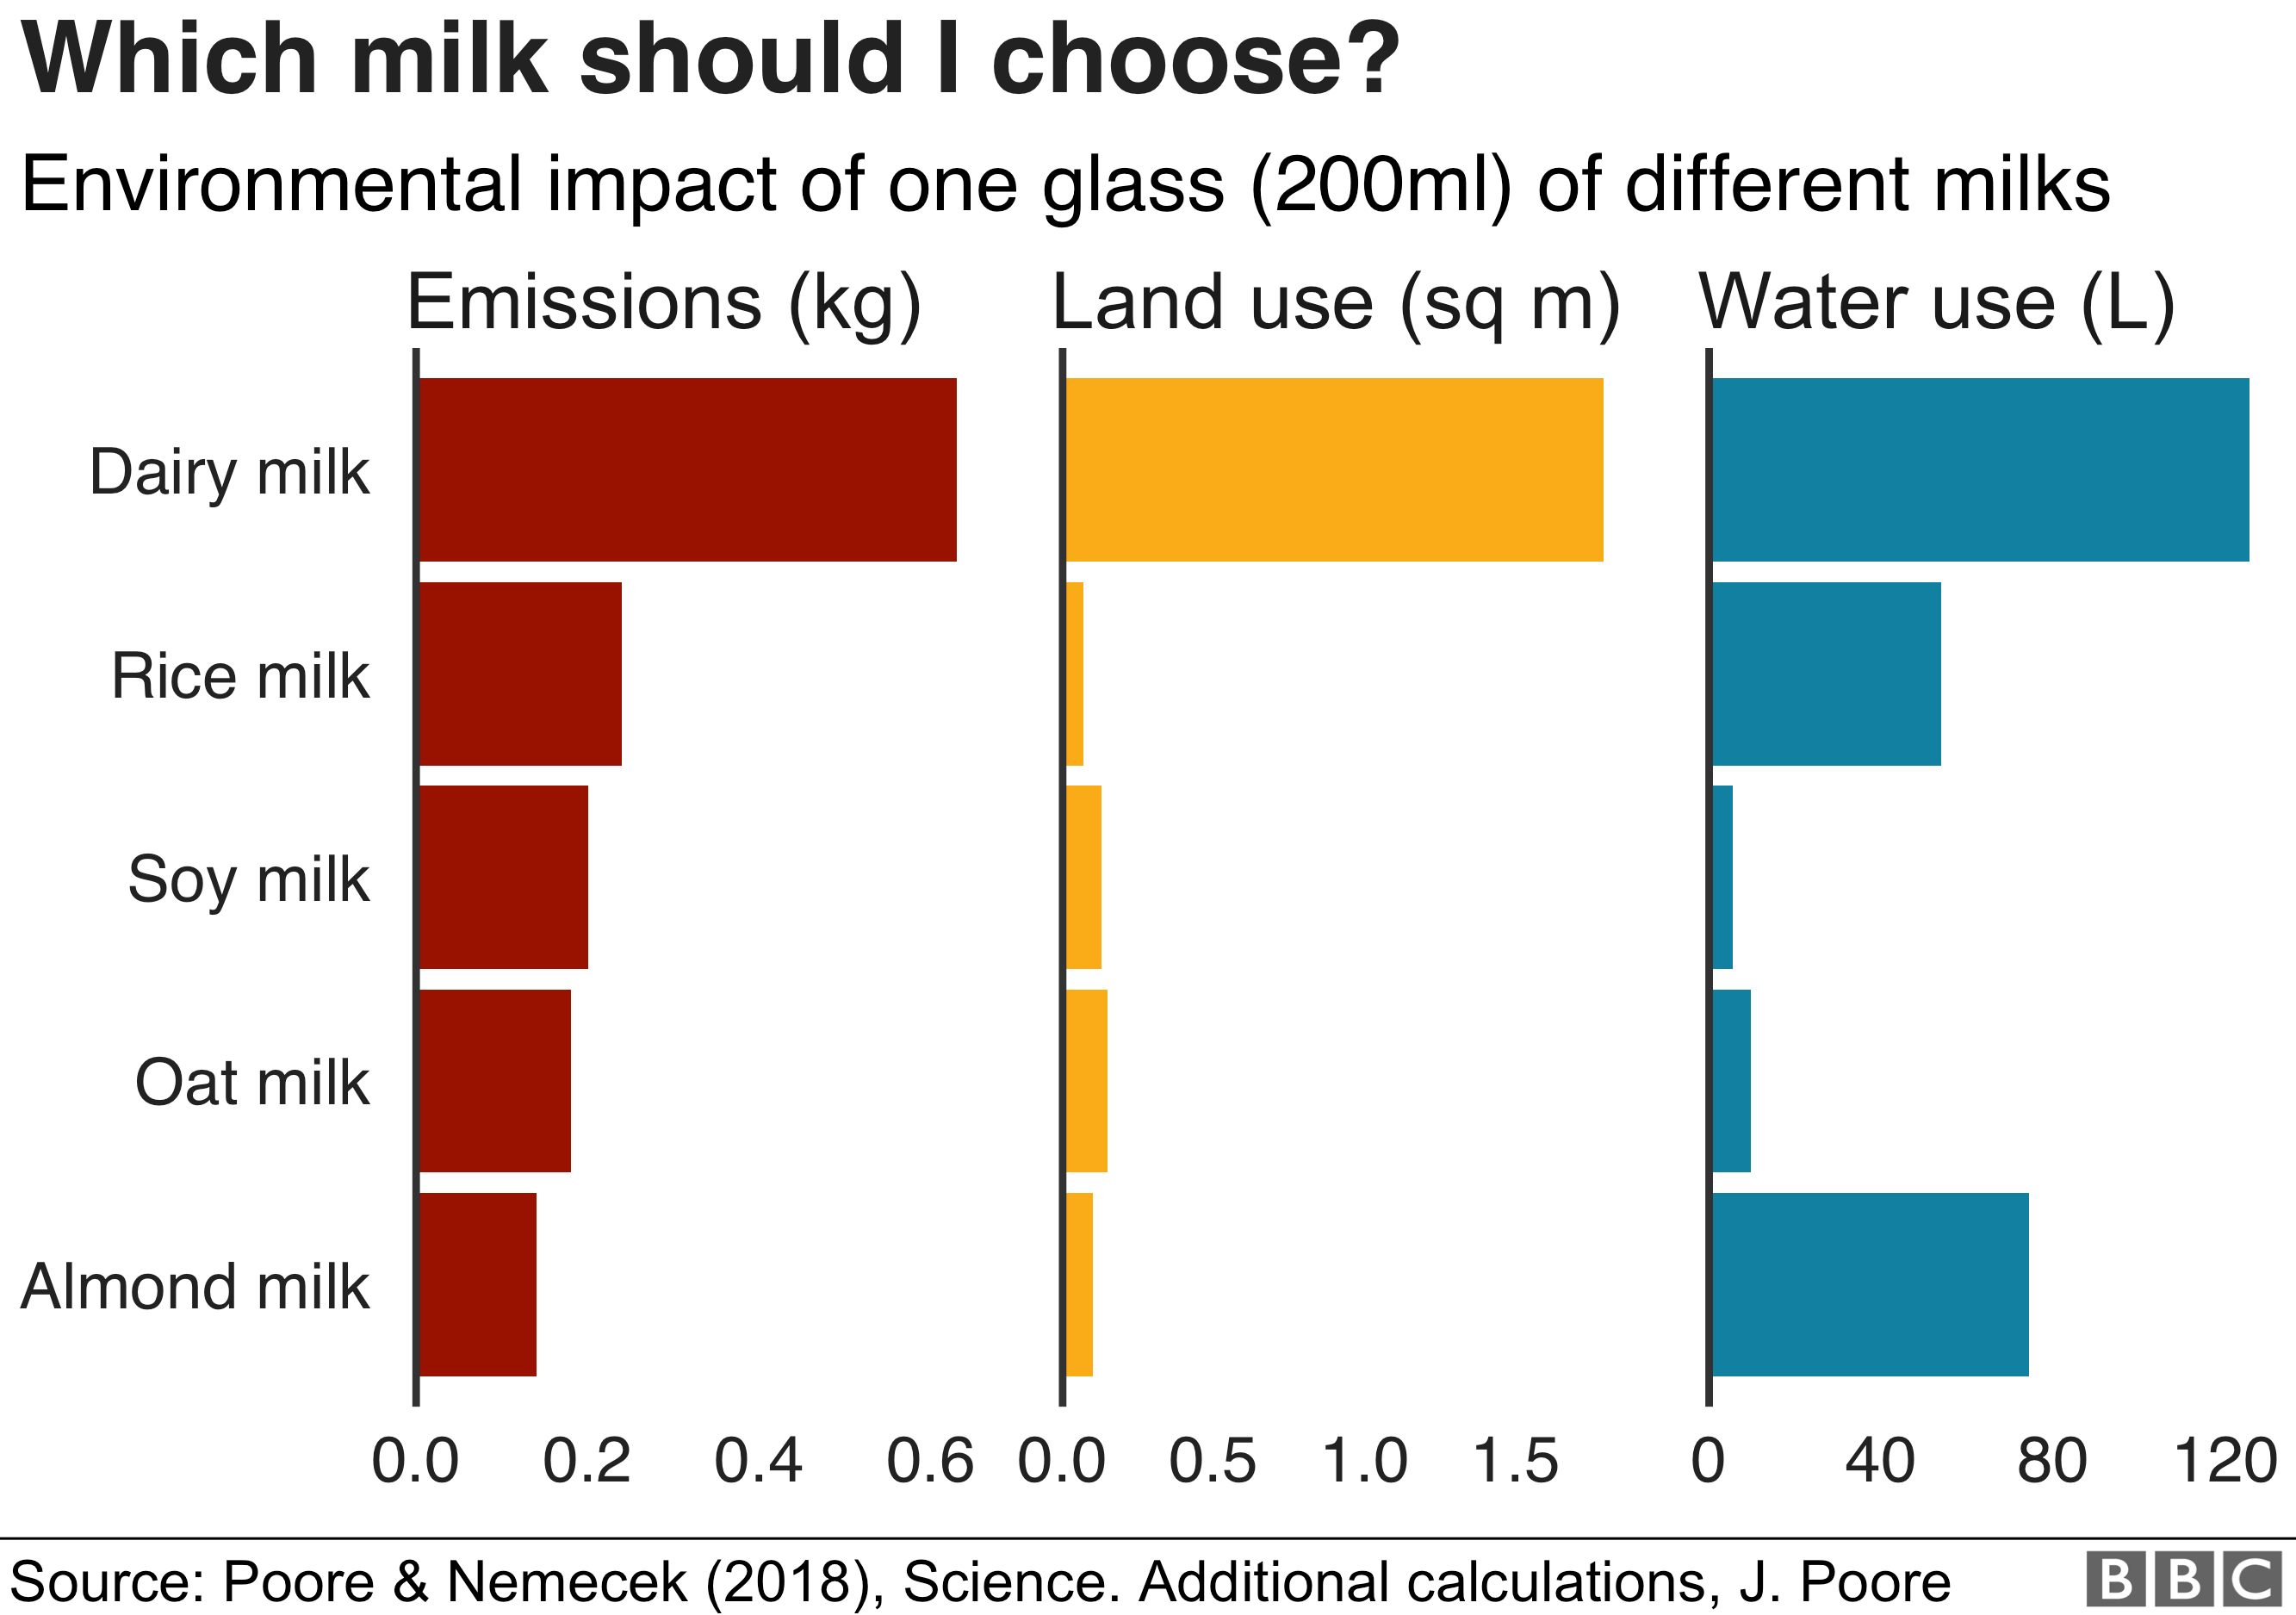
Why Your Choice of Milk Matters
Okay, so you get that the coffee beans themselves are pretty bad for the environment. But did you know that milk makes up to 60 to 70 percent of the carbon cost of a cup of coffee? Even more if it’s a latte.
Don’t worry, you don’t have to start drinking your coffee black. You can just switch to a non-dairy alternative. Interestingly, dairy milk produces almost three times more greenhouse gases than any plant-based milk. Also, it requires nine times more land to produce. (Poore & Nemecek, 2018). So, which are the best options for milk?
The average cup of coffee contains about 18g of green coffee, so 1 kg of it can make 56 espressos (The University College, London). In 2021, coffees that go with mil such as regular lattes add a carbon footprint of about 0.55 kg CO2eq more to the coffee cup. Cappuccinos followed with 0.41 kg CO2eq, and flat whites with 0.34 kg CO2eq. (The University College, London)
Yet, when produced with sustainable practices, these values fell to 0.33, 0.2, and 0.13 kg CO2eq (The University College, London, 2021).
But that’s just the Beans!
We also need to consider the impact of sugar, cocoa, and other ingredients. That includes the impact of takeaway cups. Overall, the broader picture is unfortunately grim.
As it is, demand for coffee is only going up. In Australasia, coffee is now part of most Australians’ morning routine. In 2021, Australians consumed around two kilograms of coffee per person (Statista, 2022).
Further, between 2021-2026, the market for coffee in Australia will reach a Compound Annual Growth Rate (CAGR) of 2.19% (Mordor Intelligence, 2021).
By comparison, the Compound Annual Growth Rate in the USA will rise by 8.7% by 2025. The UK’s growth rate will rise by 10.5%. New Zealand’s will rise by 9.1%, and China’s growth will soar to 11.6% over the same period (Roughan, 2020).
Use this Impact Calculator to measure the carbon cost of your coffee.
How Coffee Producers Can Reduce the Industry’s Carbon Footprint
First of all, using cargo ships instead of air freight to export coffee greatly reduces carbon emissions. In addition, using organic waste rather than chemical fertilisers further reduces emissions. More offsets come from using recycled plastic and plastic substitutions for packaging.
On top of that, certification schemes, like FairTrade, exist to ensure coffee producers meet an ethical standard. These attest that the coffee was grown sustainably, and is economically viable for the farmer.

5 Ways to Lower the Carbon Cost of Your Coffee
Luckily, there are a few simple actions you can take to responsibly enjoy your coffee
- Re-use ground coffee, or use it as organic fertilizer
- Always use your own cup. Avoid single-use cups
- Drink coffee that has been certified. For example, in Australia, you can find at Coles Ethiopian Arabica Coffee Beans or McCafé has a Rainforest Alliance Certification.
- Cut down on dairy milk or switch to non-dairy alternatives
- Try to consume organic coffee beans
We can all contribute! The Thrive Project Tool
Overall, improvements in coffee production also rely on measuring the environmental impact of businesses. So, by comparing scores we can choose the responsible coffee producers and global coffee brands.
Now, the THRIVE sustainability measurement tool lets you measure the social and environmental impacts of a variety of businesses. To find out more, visit our website and work with THRIVE for a better future for all!
This article was produced by a team of researchers and editors at THRIVE, including Agustina Scampini, David Whitely, Pujan Pun, and Rebecca Deer.